
Summarise the information by selecting and reporting the main features, and make comparisons where relevant.
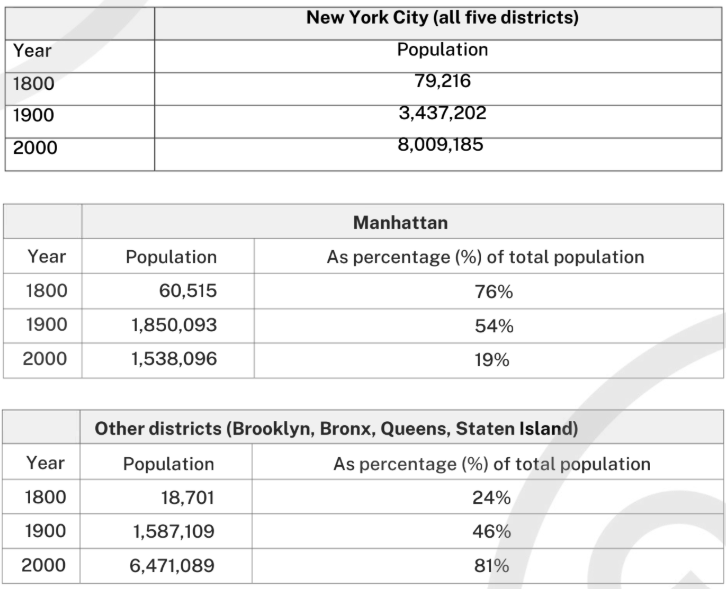
The first table presents changes in the total population of New York City from 1800 to 2000. The accompanying pie charts illustrate how the population was distributed among the city’s five boroughs—Manhattan, Brooklyn, the Bronx, Queens and Staten Island—over the same period.
Overall, New York City experienced substantial population growth across the two centuries. At the same time, while Manhattan initially accounted for the majority of residents, its proportion declined considerably, whereas the combined share of the other boroughs increased.
With regard to the total number of inhabitants, the city’s population rose dramatically from just 79,216 in 1800 to 8,009,185 in 2000. This represents an extraordinary expansion, reflecting the city’s transformation into a major urban centre.
In terms of population distribution, Manhattan was by far the most densely populated borough during the nineteenth century, accommodating the vast majority of residents. However, by 2000, this pattern had reversed. Manhattan’s share had fallen sharply to 19%, while the remaining four boroughs collectively accounted for 81% of the total population. This shift indicates a clear movement of residents away from the city centre towards outer districts over time.
Band Score 5.5The tables contain the information about the changes in total population of the New York City from 1800 to 2000 and changes in population of five districts namely Manhattan, Brroklyn, Bronx, Queens and Staten Island over the same period Firstly, in the year 1800 the population in the city among all five districts was 79,216, but had a dramatic increase by the year 1900 of about 3,437,202 continued by the slight increase to 8,009,185 in 2000. Secondely, here we have the comparision in the changes between the Manhattan and other four districts for the change in population over the years. The population initally started with 60,515 that is 76% in Manhattan in the year 1800, wherein the opposite in the other four districts having the least population of 18,701 which comes to 24% in the same year. On the other hand, Manhattan's population increased to 1,850,093 in 1900 with the change of 54% and the other four having the population of 1,587,109 with 46% changes. Finally, the population again reduced to 1,5387,096 and 19% in 2002 in Manhattan and had a drastic increase of population to 6,471,089 with 81% in other fout districts.
Band Score 6.5The tables illustrate the changes in the population of New York City as a whole and in Manhatan and other four districts in 1800 ,1900 and 2000. Overall, the population of New York City increased dramatically over the period. While Manhatan accounted for the vast majority of the city's population in 1800, its share declined subsequently over the following two centuries. In contrast, the other four districts experienced coinsiderable growth and became home to the majority of New Yorkers. In 1800, New York City had only 79216 inhabitants, of whom 60515(76%) lived in Manhatan. The other districts accounted for just 18701 (24%) . By 1900, the city's population had risen sharply to 3437202. Manhatan's population reached 1850093, representing 54% while other districts had 1587109 residents (46%). In 2000, the total population more than doubled to 8009185. Manhatan's population fell slightly to 1538096,reducing its share to 19%. in contrast, the other districts grew substantially to 6471089,accounted for 81% of the city's population.
Band Score 6The tables illustrate the changes in the population of New York as a whole and show how the population was distributed between Manhattan and other four districts from 1800 to 2000. Overall, New York City experienced a dramatic increase in population over the 200-year period. While Manhattan was by far the most populous area in 1800, its share of the city's population declined considerably, and by 2000 the other four districts accounted for the vast majority of the residents. In 1800, New York city had a total number of population 79216, of whoom 76% lived in Manhattan. By 1900, the city's population had risen substantially to 3437202,with Manhattan 54% of the total. However, by 200, although Manhattaen's population had fallen to 1538096, the total population oif the city had more than doubled to 8009185. In contraast, the population of the other four districts increased dramatically throughout the period. In 1800, these areas had only 18701 inhabitants, representing 24% of the city's population.Their population surged to 1587109 in 1900, when they accounted for 45% of the total. By 200, their population had reached 6471089, or 81% of New York City's total population.
Band Score 4the table illustrate the alteration of the people in different districtt of new york that were manhattan and some other district in several period of time overall, the population of other district slightly increased while the population of the manhattan descreased the number of resident living in the several district increases to 81 % till in 2000, there population were decreased from manhattan till 1990 but in 2000 there population increased on the other hand, the citizen of the manhattan slightly increases from 1980 to 1990 but inn 2000 the population decresed sharply in term of other district. the population of other district play cruical role in the populaton of the new york
Band Score 5.5The first table illustrates changes in the total population of New York city from 1800 to 2000. The second and third tables indicate changes in the population of the five districts of the city. Overall, the total population of New York city and other stricts increased significantly, whereas proportion of total population in Manhattan declined shrply over the period. As for New York city, the total population in 1800 was at 79,716, which was the largest among three categories, incraesing to 3,437,202 in 1900. It finally peak at 8,009,185 in 2000. In terms of Other districts, the total population and percentage grew sharply. It initially stood at 18,701 and 24% in 1800, soring to 1,587,109 and 46% in 1900 and overtaking the population of Manhattan between 1900 amd 2000. it reached 6,471,089 and 81%, making it the second largest category. on the other hand, Manhattan declined over the period, it stood at 60,515 and 76% in 1800, decresing significantly to 1,850,093 and 54% in 1900. It finally reached 1,538,096 and 19% in 2000.
Band Score 6The tables show changes in the population of New York City and its five districts beetween 1800 and 2000 years. Overall, the population of the city increased very sagnificantly during the period. Manhattan was the main part of population in 1800, but by 2000 the other districts had much more population than Manhattan. In 1800 year, New York City had only 79,216 people. Manhattan contained 60,515 of them,which was 76% of the total population. The other four districts had just 18,701 people, or 24%. By 1900, the total population had grown to 3,437,202.Manhattan population increased a lot to 1,850,093,although its persantage went down to 54%.At the same time, the other districts had 1,587,109, making up 46% of the city. In 2000, the population reached 8,009,185. Manhattan population decreased to 1,538,096, and its sharewas only 19%.In contrast , the other districts grew strongly,reaching 6,471,089 people, or 81% of the total. Therefore, most of population growth happened outside Manhattan.
Band Score 6.5The first table illustrates the total population of New York City from 1800 to 2000 while the second and third tables compare the population of the five districts of the city over the same period. Overall, New York's population significantly increased over the period. The population of Manhattan soared in the first 100 years and slightly decreased afterwards, while its percentage of total population significantly dropped throughout the period. The population of other districts and its percentage considerably rose over the period. The number of people in New York City increased manyfold over first 100 years from 79,216 to 3,437,202 and more than doubled afterwards to 8,009,185. Manhattan's population also rose manyfold from 60,515 in 1800 to 1,850,093 in 1900, but then slightly declined to 1,538,096 in 2000. By contrast, its percentage dropped over the period from 76% to 54% in 1900 and to a mere 19% in 2000. The population of other districts grew from 18,701 in the first year to 1,587,109 in 1900 and increased more than fourfold in 2000 year to 6,471,089. Similarly, its percentage soared from almost a quarter in 1800 to a hefty 81% in the last year.
Band Score 6.5The first table illustrates the changes in the total population of New York City from 1800 to 2000. Whereas the second and third table shows the population changes in five different districts of the city (Manhattan, Brooklyn, Bronx, Queens, Staten Island) during the same period. Overall, the population of New York City grew significantly over the 200-year period. While Manhattan contained the majority of the city's population in 1800, its share declined steadily, and by 2000 most residents lived in other four districts. In 1800, New York City had a population of only 79.216 people. Of these, 60,515 lived in Manhattan, accounting for 76% of the total population, while the remaining 18,701 people (24%) lived in Brooklyn, the Bronx, Queens and Staten Island. By 1900, the city's population had increased sharply to 3,437,202. Manhattan's population also rose dramatically to 1,850,093, although its proportion fell to 54%. Meanwhile, the combined population of other district's reached 1,587,109, representing 46% of the total. By 2000, New York City's population had grown further to 8,009,185. However. Manhattan's population had declined to 1,538,096, reducing its share to just 19% of the city's population. In contrast, the combined population of the other four districts increased substantially to 6,471,089, making up 81% of the total.
Band Score 6In the tables shown the first table shows the total population of New York city while the second and third table shows the stake of the disctrict on the total population of New York City. The period of the three tabels is all between 1800 and 2000. Overal the total population of New York City has increased but the percentage of people living in Manhattan has decreased while the other disctricts have seen an increase. In the first table the gradual increase in population of New York City as a whole is shown with there being 79216 people in 1800 and in 2000 there being 8009185. The city has grown the most between 1900 and 2000 with an increase of 4,5 milion people. In the second table the percentage of people living in the district Manhattan is shown. Manhattan was in 1800 the largest share holder of residents in New York City with it having 76% of all the people living in that district. Over the years that share declined with it having 54% in 1900 and 19% in 2000. When looking at the last table the percentage of people living in New York City but not in Manhattan is given. In the 1800 that percent was only 24% but in 2000 has risen to 81%.
Band Score 6The table compares the change in the total population of New York city and five districts of the city (Manhattan, Brooklyn, Bronx, Queens, Staten Island) in percent from 1800 to 2000. Overall, there is a significant increasing in the population throughout the period. While, Manhattan has the highest share at the beginning of the period later this was suprassed by other districts at the end of the period. The total population of New York City rose gradually, rising from 79,216 to 8,009185. In 1800, the total residents in New York City was 79,216 where Manhattan has contribution of 76 percent which was the highest and other districts has 24 percent contribution to the total population. In 1900, Manhattan has 54 percent of the population which has decreased slightly than previous year but it was dominant. While, the total population of Other districts has also increased slightly from 24 percent to 46 percent in 1900. In 2000, Other districts has suprassed the population of Manhattan by 81 percent which was the highest increased of the population during the given period.
Band Score 5The table compares the changes in the total population of New York city and the other five districts of the city (Manhattan, Brooklyn, Bronx, Queens, Staten Island) from 1800 to 2000. Overall, New York recorded the highest number of populations, making it the most populated city among other mentioned districts. The highest populated district was Manhattan, which collectively recorded the percentage of other districts of New York, followed by the other districts in the same period. In details, New York city accounted for 8,009,185 of total populations in 2000 as compared to the previous year, population rose significantly by 5 thousand. The total population of Manhattan stood at 76% in 1800 but dropped by 57% in 2000. The total population of the other districts accounted for 24%,46% and 81% respectively. Collectively, other districts represent a drastic increase in the proportion of populations, slightly exceedingly the percentage of Manhattan from 1800 to2000. Whereas in 2000 Manhattan recorded 19% of population drop. Other districts, on the other hand depicts a rise of 57% in the same year.
Band Score 6.5The table illustrates the total population of New York City, and the other two tables compare population in five different districts, including Manhattan, Brooklyn, Bronx, Queens, and Staten Island, between 1800 and 2000. Overall, it can be seen that the population significantly increased in all districts throughout the period, except in Manhattan, where the number of people started declining after 1900. In addition, the majority of the population was recorded in the Manhattan district in 1800, compared to the other four districts; while this trend was totally opposite in the last year, when the smallest proportion of people lived in Manhattan. In terms of Manhattan's population, 60,515 people were recorded in 1800, which made up 76% of the total population. This number increased considerably to1,850,093 in 1900, before showing a rapid decline in the last year and made up only 19% of the population. The population in the other four districts accounted for 24% of the total population in the initial year, then inclined dramatically to 6,471,089 in 2000, which was 81% of the total population. Meanwhile, the total figure rapidly rose from 79,216 in 1800 to 8,009,185 in 2000.
Band Score 5.5The first table illustrates changes in the total population of New York City from 1800 to 2000. The second and third tables show changes in the population of the five districts of the city over the same period. The five districts of the city are Manhattan, Brooklyn, Bronx, Queens, and Staten Island. Overall, all five districts population are increased in every year. While at the same time, the Manhattan population is fell down in the following hundred years. Same as the period, other districts population percentage is rose rapidly. Looking at the details, all five districts populations in 1800 were 79216. After 100 years population amount is increased in more than 3,357,986. Then year of 2000 population is 8,009,185. Manhattan shows the date were year of 1800 population percentage is 76%, at the amount us 60515. After 100 years, decrease in 22%, at the amount is 1,850,093. The 2000 year of population is always down fall it. that percentage is 19%, population amount is 1,538,096. Other districts total population percentage is year of 1800 was 24%. After 100 years, the increase in the population percentage is 46%. The 2000 total population percentage is 81%.
Band Score 5All of the three below show the population of New York city and their distriction's population changes from 1800 to 2000. So at the first below we can see New York's population: It was so low in 1800 and from the 1900 it will grown so fast. And in Manhattan we can see same situation. IT was grown so fast from 1800 to 2000. For example in other districts in 1800 population was 24% and in 2000 it was grown to 81%. It is so huge amount of changes. New York's population was grown fast in these year. It also affected to other districts. In the 1800 in new york was 79216 and in 2000 it was grown to 8009185. In my my opinion it is huge amount of changes.
Band Score 3.5Three tables bellow show us information about population from 1800 to 2000, the first table contains information about total population in five districts at New York. In the second table, it explains information about population in Manhattan district, and for the last table giving information about population in other districts, such as Brooklyn, Bronx, Queens, Staten Island. overall, all the districts increased significantly over the period. In 1800 all of it began from bellow, New York started counting the publics in 79.216 pupils. Manhattan show the percentage for the population ini 76% wich is 60.515 people. And for other districts it's only show percetage in 24% wich mean they only had 18.701 publics, this number so far away from New York City and Manhattan. After ten decades, population rose dramatically, aspecially ini other districts. It's rising almost 9 times population from the past from 18.701 rose to 1.587.109. New York rose the population to 3.437.202 wich is almost 4 times compared with the first year. The last table, that's it Manhattan showed population increasing almost 3 times. it's began in 60K and rosed to 1.838.096. New York leaded the number of population in 2000, its's increased until 8.009.185. This number actually didn't increaded too much but when it's compared with an other districts it will be the most population. Manhattan showed that only this contry decresed the number of population in this table. Grom 1,8 million it's decreased to 1,5 million. and for other disctrict showed the same data with New York. Number of people rosed until 4 times to 6,4 million. Conclution from all of the data is, all district had increased all the time from 800 until 20 decades after except Manhattan in 1900, that was decreased almost 300.000 person.
Band Score 7The tables compare changes in the population of New York City between 1800 and 2000, with separate figures for Manhattan and the other four districts (Brooklyn, the Bronx, Queens, and Staten Island). Overall, the total population of New York City increased dramatically over the 200-year period. Although Manhattan remained the most populated district in 1800 and 1900, its population and share of the city's total declined by 2000, while the other four districts experienced substantial growth and became home to the vast majority of residents. In 1800, New York City had a population of only 79,216, of whom 60,515 (76%) lived in Manhattan. The remaining 18,701 people, representing 24% of the total, resided in the other four districts. By 1900, the city's population had risen sharply to 3,437,202. Manhattan's population also increased significantly to 1,850,093, although its share fell to 54%, while the combined population of the other districts reached 1,587,109 (46%). By 2000, the total population had more than doubled from the 1900 figure to 8,009,185. However, Manhattan was the only area to record a decline in population, falling to 1,538,096, and its proportion of the city's residents dropped markedly to just 19%. In contrast, the population of Brooklyn, the Bronx, Queens, and Staten Island grew rapidly to 6,471,089, accounting for 81% of New York City's total population.
Band Score 7The tables illustrate the changes in the total population of New York City and compare the population figures between Manhattan and the other four districts (Brooklyn, Bronx, Queens, and Staten Island) from 1800 to 2000. Overall, New York City experienced massive population growth over the two-century period. Additionally, while Manhattan initially held the vast majority of the city's residents, its population share plummeted significantly by 2000, losing its dominance to the other districts. In 1800, the total population of New York City was quite small, at only 79,216 residents. Manhattan was the most populated area, housing 60,515 people, which accounted for 76% of the city's total. By 1900, New York's population surged to nearly 3.44 million, with Manhattan's population peaking at approximately 1.85 million, though its percentage share dropped to 54%. By the year 2000, despite the city's total population reaching a staggering 8,009,185, Manhattan's population actually decreased to 1,538,096, representing just 19% of the total.In contrast, the other four districts saw continuous and rapid growth. In 1800, their combined population was merely 18,701, making up just 24% of New York City. However, this figure grew exponentially to over 1.58 million 46% in 1900. By 2000, the population of these districts skyrocketed to 6,471,089, overwhelming Manhattan and constituting the vast majority 81% of New York City's total population.
The first table illustrates the changes in the population of New York City between1800 to 2000. The second and third tables illustrate changes in the population of five districts of the New York City over the same period. Overall, the total population saw a significant increase . The largest proportion of population lived in Manhattan in 1800, but by 2000 most of population lived in other districts of New York City. The total population of New York City was almost 80,000 people in 1800, which dramatically climbed to over 8 million by 2000. Focusing on Manhattan, 76% of total population of New York City lived here in 1800 (over 60,000 people). This figure dropped first to 54 % (over 1,850,000 people) in 1900 and to 19% in 2000. Turning to other districts (Brooklyn, Bronx, Queens, Staten Island), 24% of total population of New York City lived in these districts in 1800. This figure increased to 46% in 1990 and to 71% by 2000.
It's helpful