
You should spend about 20 minutes on this task. Write at least 150 words.
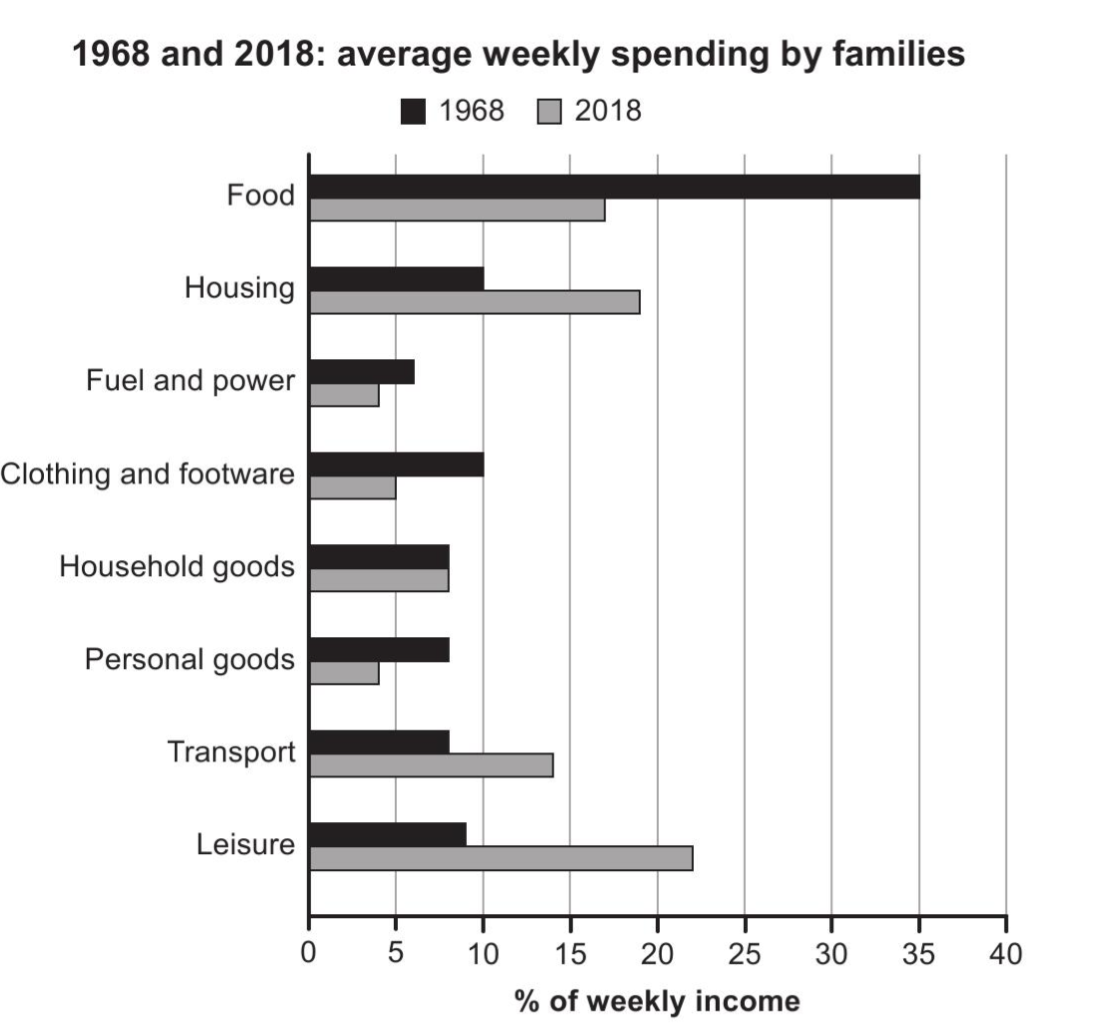
The chart below gives information about how families in one country spent their weekly income in 1968 and in 2018.
Summarise the information by selecting and reporting the main features, and make comparisons where relevant.
Summarise the information by selecting and reporting the main features, and make comparisons where relevant.
The bar chart illustrates the average weekly expenditure of families in a particular country across eight different categories, comparing the years 1968 and 2018. The figures are presented as percentages of total household income.
Overall, it is evident that spending patterns shifted considerably over the 50-year period. While food was the dominant expense in 1968, housing overtook it as the largest category in 2018. Additionally, expenditure on leisure and transport increased substantially, whereas spending on clothing and footwear, as well as personal goods, declined.
In 1968, the most significant outlay was on food, accounting for 33% of weekly income, which was more than three times the amount spent on housing at just 10%. Similarly, clothing and footwear represented a notable 7% of the budget. Fuel and power, household goods, and leisure each accounted for 5% of spending, while transport and personal goods both stood at 5% and 3% respectively.
By 2018, the pattern had reversed dramatically. Housing expenditure rose to 23%, making it the single largest category, while spending on food plummeted to 17%. Transport and leisure also saw significant increases, both rising to 14% and 13% respectively. In contrast, the proportion of income spent on clothing and footwear fell sharply to 5%, and personal goods declined marginally to 3%. Expenditure on household goods remained unchanged at 5%, while fuel and power stayed constant at 5%.
In conclusion, the most notable changes over the five decades were the shift from food to housing as the primary household expense, alongside a growing emphasis on leisure and transport, suggesting a transformation in lifestyle priorities.
Band Score 6The bar charts illustrates weekly salary spendings on various types of goods in 1968 and 2018 of one country. Overall, it can been seen that in 1986 people spent their weekly income mostly on food, while in 2018 the most popular spending was on leisure category. The least amount of money were spent on fuel and power in both time periods, personal goods in 2018 had the same amount. Starting with families in 1968, they spent 35% of their weekly income on food, which is the highest indicator out of all categories. Second place takes housing and clothing and footware both sharing 10% of weekly income. Other categories is on similar level of aroung 8%, and fuel and power had the smallest percentage of spending, 6%. In 2019 people spent more on leisure activities, about 23%, which is almost three times higher than those in 1968. Housing and food had about 19% and 16%, respectively. Household goods is similar as the in 1968, which is 8%. Thw least popular category was transport and fuel and power, which are at the same rate of 4%. In conclusion, in 1968 people spent most of their salsries on food and house needed spendings, while in 2018 families spent their money mostly on leisure.
Band Score 5.5The chart demonstrates the information about families spending their weekly income between 1968 to 2018 in one country. Overall, It shows that the highest spending was on food in 1968 year where it seems that leisure was highest in 2018. Similarly, Household goods seems to be at stable between both years. In 1968, they spend their income excessively on food. However, they spend minimum in fuel and power. Additionally, It shows that their spending on household goods, personal goods and transport were equal about 8%. Simutaneously, clothing , footware and housing also have the equal spending on their lives at 10%, In 2016, comparing to 1968 they spend their income on leisure morely and it is also the highest spending of their income about 23%. Continuosly, it shows that they minimize their spending on food, fuel and power, clothing and footware, personal goods comparing to 1968. However, tranport snd housing were increased their spending excessively.
Band Score 5.5The bar chart provides data on average weekly income spending by families in one country in 1968 and in 2018. Overall, it is evident that in 2018, they spend highest on leisure.In 1968, the highest spending was on food.In term of household goods they spend same in both years, while they spend the lowest on personal goods in 2018. In term of food, they spend highest of their weekly incomes by nearly 35% and in 2018 spend around 17%.On housing, in 1968 the proportion was only 10% and in 2018 reached to just below 20%.In 1968, they spend the lowest on fuel and power and in 2018 they their weekly icome nearly 4%.On clothing and footware, their weekly income spend areound 10% and in 2018 they spend 5%. On household goods, the spend same in both years appoximatly 7%.In 1968, families spend their weekly income on personal goods was nearly 7% and in 2018 they spend nearly 4%.In term of transport, families spend the most in 2018 than 191968.On leisure, families spend highest of weekly incomes in 2018 by neary 22%, where in 1968 spend only 8%.
Band Score 6the charts illustares information about how families in one country spemd thire weekly income in 1968 and 2020. Overall, food was by far the highest figure at 35 % in 1968, wheras other figure showed relatively lower percentage at less than 10%. However, in 2018, expenditure for leisure, housing and food illustrate higher proportion. As for expenditure in 1968, food was at 35%, which makes it highest figure in 1968. However, expenditure for housing, clothing amd footware showed a lower figure at both 10%, which were the second highest category in 1968. Moreover, other categories such as leisure or transport were relatively similar proportins at approximately 8% or less. In terms of expenditure in 2018, leisure was the highest figure among eight categories at around 22%, closely followed by housing and food at around 19% and 17%, respectively. Moreover, transport also showed a significant increase from 8% to 14%. However, household goods remaind unchanged over the period at around 7% amd fuel, power were the lowest category in both years at around 5%.
Band Score 6The chart demonstrates the weekly spending of several households in a certain country in the years of 1968 and 2018. Overall, the average weekly spending on food has significantly decreased over time. Moreover, while food consumed the highest income in 1968, leisure was the highest in 2018. In 1968, consumption on food took the first place with 35% of weekly income. Spending money on leisure came second with a little over 20%. Almost similarly, people would use their money on housing and transport as they took a bit below 20%, and around 14% of their weekly income, respectively. Meanwhile, in 2018, people would be spending approximately 22% on leisure every week, marking the highest percentage of their income. Housing comes second with more than 15%. Also, spending on transport consumes around 14% of their income. As seen from the chart, in both years, least is spent on fuel and power, clothing and footware, and household and personal goods.
Band Score 6The bar chart below provides information about families' spent of their weekly income between 1968 and 2018. Overall, the diagram has several categories, such as food, housing, household goods, personal goods, transport, leisure fuel and power, and clothing and footwear. In 1968, average weekly spending was different compared to 2018. In some units change of spending salary by families was significant, and in others it was slight. In 1968, the food category had the highest spending percentage at 35%, housing and clothing had similar percentage at 10%, leisure had around 8%, transport, personal and household goods had almost same percentage at about 7%, and fuel and power had the least income spending at approximately 6%. In 2018, 50 years later the picture was changed sharply. Leisure had incredible increase to 22%, becoming the highest spending percentage, housing and transport also had significant rise to 18% and 14%. Nevertheless, the rest units had decreased. Food dropped rapidly to 17%, fuel and power with personal goods fell to 4%. Clothing and footware decreased to 5%. Household goods didn't have a change.
Band Score 6The chart below gives information regarding the average weekly spending by families in fifty years difference 1968 and 2018. The chart has several categories such as, food, housing, fuel and power, clothing, households-personal goods, commute transport and leisure. Fifty years ago, most of the families spend their weekly salary in the food reaching 35%. This percentage had been significantly increased with huge difference on other expenses that didn't surpass 10% of the salary. On the other hand, in recent year 2018 major weekly expenses of the families are in food, housing and leisure and less in transport and in other fixed expenses. Moreover, in both years fuel was the least of the expenses, while up to 10% had been and still are all the other expenses with a slightly difference in transport. To sum up, most of the expenses in both years have been spent in food, housing, transport and leisure, basic things that people need in order to have a work life balance.
Band Score 5the line graph show information about how families in one country spent their weekly income in 1968 and in 2017. overall, there eight thing to most spent weekly by the families. the food,house, fuel and power, clothing and footware, household goods, personal good, transport and last leisure. most income spent in foods and less one is fuel and power. Start with in 1965 that years most foods which is 35% . housing and clothing and foodware has similar spending which is 10% . after that household goods, personal goods and transport are 8% that years . leisure 9% and last one is fuel power with 6% . But in 2017 most spending was leisure with 23% which is most spend income. housing 19% and transport 14% all other was under the 10% . with this chart we can see most of the people is spend on food, housing and other thing .
Band Score 5The bar graph demonstrates the proportion of how families in one country consume their weekly salaries. Overall, most families spent largest proportion of their weekly income on food in 1968 and the lowest percentage represents fuel and power. In 2018, many families spent their money of leisure. In 1968, the domestic unites spent 35% of their weekly payment on food. They spent 10% on housing with same percentage in clothing and footware. On the other hand, household goods, personal goods, and transport shows the same proportion in 1968 which is almost 8%. Families in 1968 spent lowest salaries on fuel and power that was about 6%. In 2018, families spent most of their income on leisure the total percentage is approximately 22%. They also spent about 3% percentage in two things which are fuel and power and personal goods. Moreover, households consume almost 18% of their salaries on housing and around 13% on transport. At the end, it is clear that the choices how to spend their money were different with time.
Band Score 5.5The bar chart gives the information about the average weekly expenditure of the family in a certain country in 1986 and 2018 such as food, housing, fuel and power, clothing and footware, household goods, personal goods, transport and leisure. Overall, in 1968, highest amount of salary was spend on food whereas least was on fuel and power. But largest percentage of income was spend on leisure and minimal amount was spend on personal goods and fuel and power in 2018. Equal amount was spend on household goods in both year. In 1968, it is evident that highest amount of income was spend on food around 35 percentage and lowest was spend on fuel and power around 6 percentage. By comparsion, equal percentage of income was spend on housing and clothing and footware (around 10 percentage) as well as on personal goods, household goods and transport (around 7 percentage). The percentage of income spend on leisure was around 9 percentage. In 2018, the percentage of money spend on leisure was around 23 percenatge, which was highest followed by housing around 18 percentage. The least amount was spend on fuel and power and personal goods (around 4 percentage). It is noticeable that same amount was spend on household goods in both years (around 7 percentage). The expenditure on spend on food has decreased, declining from 35 to 17 percentage. Spending on transport has increased, rising from 7 to 14 percentage. Clothing and footware has decline from 10 to 5 percentage.
Band Score 5.5The chart illustrates the information regarding how the money was spread in one country of their weekly income of families in 1968 and in 2018. Overall, it can be seen that the highest money was spent by food in past year, but the the leisure will carries highest money spent from families in future. Otherwise, different food are fluctuate condition and the household carries equal money from families in same two year. In past year, many families bought the food with 35 percentage from weekly incomes is largest in module. Fuel, clothing and personal goods are more money spent in 1968, whereas the fuel and powers has lowest money spreading by families from weekly incomes, then the household carries equal in both year with 8 percentage of money. In comparison of 1968 and 2018, their are highest money spent from 1968 compare to future. In future many families are spending money from leisure which is highest in 2018 with 22 percentage. Housing, transport and leisure have highest money carries by families compare to past year with 8 percentage.
Band Score 5the chart shows that in 1and968 and 2018 how families in one country weekly spending average and how much percentage of weekly income . overall we have observed that food in 1968 it is the highest amount of money spending by families wheres as the mejority of leisure in 2018. another one entreasting is the perciental is same that is households goods in 1968 and 2018. Another is personal goods and transport isin 1968 that is the same persentail yhat is the same income spend by families. the housing in 1968 the weekly income is 10% in 2018 that is 15.6% income will be spend another one is fuel and power that is not in 1968 nad 2018 there will be not average income weekly spending by families anothe one is clothing and footware is in 1968 the 10% of income spending and 2018 that is 5% income. overall in 1968 and 2018 the average weekly saending by families is more than in food . that is more relevant.
Band Score 6.5The given chart depicts information on average weekly spending by families in one country in the year 1968 and 2018. Overall, we can observe that the highest amount of money was spent on food in 1968 whereas majority of weekly income is being spent on leisure in 2018. Another interesting figure is that the same percentile of weekly income was spent on household goods in both years. Looking further at the chart, money spent on food got almost half in 2018, which was the highest figure in 1968 accounting exactly 35%. Leisure expenditure got more than double, which was around 9% in 1968 reached about 23% in the year 2018. In 1968, families were spending 10% of their weekly income on housing which got almost double in 2018 approaching 20% mark. Transport became expensive in 2018 compared to 1968 and their figure were around 14% and 8% of the weekly expense respectively. Personal goods and clothing expenditure also decreased by almost half for the given period. The fuel and power expense was around 6% in the 1968 which decreased slightly and became 4% in 2018. Household goods have same spending in both years which is around 7%.
Band Score 6The bar graph illustrates how much proportion of weekly income spent on seven different categories by families of one nation in 1968 and 2018. Overall, it can be seen that people spent majority of their income on food in 1968, which was almost more than double to expenses on other categories. In addition, in the later given year, families spent mostly on leisure activities and housing, while other expenses were the least. In terms of food, people spent 35% of their weekly income on food, which was then almost half in 2018. Spending on housing and leisure were almost 10% in 1968, which increased significantly to 18% and 22% respectively. Expenses of household goods were relatively stable in both years at around 8%. However, for fuel and power, spending was lesser than other all categories in throughout the given years. Around 6 % of their income, spent by families on transport in 1968, which gradually rose to approximately 14% in 2018, whereas spending on personal goods decreased dramatically from approximately 4% to 8% of their income.
Band Score 6The presented chart illustrates the comparison of percentages for weekly income of families in 1968 and 2018. Overall, it can be clearly seen that the family spent most money for food in past. Another noticeable feature is that the household goods had the constant percentages of spending money in both years. Now turning to the details, the food had the highest expenditure at 35% in 1968, while it decreased to 17% in 2018. The money spent on housing,transport and leisure had lower percentages like 10, 7 and 8 in 1968 than the year 2018, where it reached to 18, 14 and 22. In contrast, other items had the highest amount of expenditure in 1968. It is worthwhile to note that, the budget spent on household goods was the same 16% in 1968 and in 2018. The fuel and power had the tiny fraction of expenditure in both years.
Band Score 5.5The chart illustrates information about how families in one country spent their weekly income in 1968 and in 2018. Income spent features are Food, Housing, Fuel and power, Clothing and footwear, Household goods, Transport, and Leisure. Overall, the family allocate most of the money to food and Housing in both years. The data clearly presents that food was the main spending item in 1968 and it was 35% of their weekly income.On the other hand, people in 2018 spend more money for leisure than other items and it is more than 20% of their weekly wedges. while housing and clothing stood at second place with 15 percent of the weekly budget spent on it. However the expenditures made on Fuel and power, and personal goods were lower during this year. The money allocated for the them was less than 5 percent. Transport also rose from around 8 percent to 14 percent. Leisure had increase to 9 percent to 23 percent.
Band Score 6The chart illustrates information about how families in one countries spend their weekly income between 1968 and 2018. Overall, expenditure for food in 1968 by far the highest figure among eight categories, while fuel and power relatively low score. Moreover, expenditure for leisure was the highest category in 2018, whereas personal goods showed low score. In terms for expenditure in 1968, food was the highest score at 35%, followed by housing, clothing & footwear at 10%, respectively. However, other categories such as household goods, personal goods and transport showed relatively same proportion around 8%. As for expenditure in 2018, leisure was the highest figure at about 22%, closely followed by housing at around 19%. Similarly, Housing and food were also higher figure at approximately 18% and 16%, respectively. On the other hand, fuel and power, personal goods were both the lowest figure at around both 4% among other categories in 2018.
Band Score 5.5The given chart shows the comparative data about how the families in one country spent their weekly income in 1968 and 2018. The data clearly presents that food was the main spending item in 1968 and it was 35% of their weekly income. On the other hand, people in 2018 spend more money for leisure than other items and it is more than 20% of their weekly wedges. One noticeable item from the graph which remained constant in 1968 and 2018 that is Household goods costing and it is in between 5 to 10%. Along with leisure, the housing and transportation cost remarkably climbed up from 1968 to 2018. Expenses on food significantly declined and it around remains only 22% in 2018 which was 35% in 1968. Fuel and power costing slightly decreased from 1968 to 2018 as well as clothing and footware expenditure decreased over the time. Personal goods expenses also fell to almost half between the given period. Housing costing rise considerably and it was 10% of weekly salaries in 1968 and rising to almost 20% in 2018.
Band Score 6The graph displays data on how families used to allocate their weekly income in a specific country in 1968 and 5 decades later . Overall, families allocate most of their money for food and housing in both years, however there are notable flactuations in these sectors. In 2018 the percentage of income accounted for food stood the highest, whereas the budget allocated for housing was lower. In 2018 there is a significant decrease on the expenditure made for food, however a significant increase on housing, transport, and leisure. To get in more details, the income accounted for food peaked in 1968 at 35 percent, while housing and clothing stood at second place with 15 percent of the weekly budget spent on it. The expenditures made on transport and leisure were lower during this year . The money allocated for the them was less than 10 percent. In stark contrast, in 2018 leisure became the sector where people make most of their expenditures, approximately 23 percent . On the other hand, the money allocated for food has seen a sharp decrease where around 22 percent of the income is spent. The money accounted for household goods have remained constant at around 7 percent, whereas the budget allocated for transport has increased up to 13 percent.
Band Score 5.5The bar chart gives information about how families expenditure their weekly income in one country in 1968 and in 2018. Overall, it can be seen that families spent their most money to bought food in 1968 while, fuel and power had the lowest spent in the same year. In 2018 also fuel and power for the transpotation had the lowest percantage in conrast, the figure for leisure time activities had the highest proportion in the same year. Fuel and power and personal goods were two catagory that had lowest percantage at almost %5 about families expenditure in 2018 in contrast, the figures for fuel and power, houshold goods, personal godds, transport and leisure time activities had the lowest percantage in the 1968 at about %8. Food had the highest amount of spent in all catagories at %35 in 1968 and in 2018 leisure time activities was the first one to families spent their money for it figure at approximately %22 to follow this housing second one it had at almost %20.
Band Score 6The chart illustrates the information about how families in one country spent their weekly income in 1968 and in 2018.We can see that the differences between years is average.An enormous space was between food and leisure. First of all,it's clear that food had the much more impact at 1968,reaching 35% of weekly income,becoming the largest spending by families.While in 2018 foods impact was just half of the past,reaching to almost 18% which I found really unexpexted and interesting.Because I thought,nowadays people are mostly keen to spend their money on different type of foods,especially on fast foods.In addition to that, interest to fast foods and junk foods are getting larger every year.Leisure is on the second place in this chart,having almost 22% in 2018 of income and 8% in 1968,which was actually obvious .To explain my point there's just a simple example,nowadays people are keen to go on vacations and rest more than in past.Transport is also essential right now and of the "must-have".In 1968,people spent only 7% of their income to transport,while in 2018 it has much more impact and reached to 14%.Housing is an unavoidable thing in our life,such as rent and etc.In 1968 housing reached to 10% leaving behind 2018,which reached to 19%.And everything else such as fuel and power,clothing and footware,household and personal goods had barely reached 5-10% at both of the years. In conclusion,people had different essentials at times between 1968 and 2018,but we should all agree that food is an unavoidable importance despite the decades.
Band Score 5.5The chart illustrates the information about how families in one country spent their weekly income in 1968 and in 2018.We can see that the differences between years is average.An enormous space was between food and leisure. First of all,it's clear that food had the much more impact at 1968,reaching 35% of weekly income,becoming the largest spending by families.While in 2018 foods impact was just half of the past,reaching to almost 18% which I found really unexpexted and interesting.Because I thought,nowadays people are mostly keen to spend their money on different type of foods,especially on fast foods.In addition to that, interest to fast foods and junk foods are getting larger every year.Leisure is on the second place in this chart,having almost 22% in 2018 of income and 8% in 1968,which was actually obvious .To explain my point there's just a simple example,nowadays people are keen to go on vacations and rest more than in past.Transport is also essential right now and of the "must-have".In 1968,people spent only 7% of their income to transport,while in 2018 it has much more impact and reached to 14%.Housing is an unavoidable thing in our life,such as rent and etc.In 1968 housing reached to 10% leaving behind 2018,which reached to 19%.And everything else such as fuel and power,clothing and footware,household and personal goods had barely reached 5-10% at both of the years. In conclusion,people had different essentials at times between 1968 and 2018,but we should all agree that food is an unavoidable importance despite the decades.
Band Score 6.5The bar chart shows how families in one country spent their weekly income on eight different items in 1968 and 2018. Overall, people spent much less money on food in 2018 than in 1968. However, spending on housing, transport and leisure increased over the period. In 1968, food was the biggest expense at about 35% of weekly income. This number fell to around 17% in 2018. Spending on clothing and footwear also decreased from 10% to 5%. In addition, fuel and power, household goods and personal goods all went down slightly. On the other hand, housing increased from about 10% to nearly 19%. Transport also rose from around 8% to 14%. Leisure had the biggest increase, from about 9% to 22%, becoming the largest spending category in 2018.
Band Score 6.5The bar chart compares how families in one country spent their weekly income on eight categories in 1968 and 2018. Overall, spending on food decreased greatly, while the percentages for housing, transport and leisure increased. Food was the biggest expense in 1968, but leisure became the largest category in 2018. In 1968, families spent about 35% of their income on food. This figure fell to around 17% in 2018. Spending on clothing and footwear also dropped from 10% to 5%. Similarly, expenditure on fuel and power, household goods and personal goods decreased slightly. By contrast, housing rose from approximately 10% to 19%. Transport spending increased from about 8% to 14%, while leisure almost doubled, rising from around 9% to 22%. Overall, families spent less on basic needs and more on housing, transport and leisure in 2018 than in 1968.
Band Score 6The bar graph illustrates how much weekly income is spent on different categories in 1968 and 2018. Overall, it can be clearly seen that most of family spend their money on food in 1968, whereas the cost of housing was highest in 2018. In 1968, 35% of weekly salary spent on food , which was highest among the all other categories. The expenditure of money on housing, clothing and footwear were 10% of income by families in 1968. Spending money on household goods was around 8 % in 1968 , that was remained same in 2018. Transport , leisure activities , personal goods and fuel were spend between 5 % and 9% in 1968. Furthermore , the cost of housing was almost double in 2018 compare to 1968 at 20% of income , and almost half of income spend on food in 2018 at 17% . However , spending on transport and leisure activities reached almost double in 2018.
Band Score 6.5The chart compares the percentage of weekly income spent by families in a particular country on eight different categories in 1968 and 2018. Overall, there was a significant shift in household spending habits over the 50-year period. Expenditure on food, fuel, clothing, and household goods decreased, while spending on housing, transport, and leisure increased substantially. In 1968,food was by far the largest expense, accounting for approximately 35% of weekly income. However, this figure fell dramatically to around 17% by 2018.Similarly,the proportion of income spent on clothing and footwear halved from 10% to 5%. Spending on fuel and power, household goods, and personal goods also experienced minor declines, each remaining below 10% in both years.In contrary, leisure and housing attracted a much larger share of family budgets in 2018. Leisure spending more than doubled from about 9% to roughly 22%, becoming the highest expense.Conclusion, leisure and housing attracted a much larger share of family budgets in 2018. Leisure spending more than doubled, percentage about 9% to become the highest expense at roughly 22%. Housing costs also a significants rise,growing from 10% to under 20%.Meanwhile, the percentage of income to transport increase gradually from approximately 8% to nearly 14% over the same period.
Band Score 6The bar chart illustrates the proportion of families spending their weekly salaries in 1968 and in 2018. Overall, in terms of food, it was the predominant category in 1968, while leisure was ranked at second in 2018 and there are lots of cases, reaming the same, falling or increasing slightly in the two periods. At first glance, food had the highest point of 35 percent of weekly income, while the others merely had the figures of approximately 8 per cent in the first year. In addition to the figures in 1968, housing and clothing, footware were ranked second at just 10 percent. By contrast, in the next 50 years, although food declined significantly to about 17 percent, it was clear that leisure apparently gained the highest position in that year, having more than 15 percent compared to the original number. Furthermore, housing and transport also had an upward trend after witnessing lower percentages, which accounted for around 18 percent and 13 percent in families' weekly spending, respectively. In the meantime, the expenses that families spent on household goods remaining the same in two years, while other categories such as fuel and power, clothing and footware, personal goods are not only low, but also decreased slightly in 2018 compared to the previous year.
Band Score 6.5The bar chart compares the proportion of weekly income spent by families in a specific nation on eight different categories in two years, 1968 and 2018. Overall, there was a significant in household spending habits over the 50-year period. Expenditures on food, fuel, clothing, and household goods decreased, while housing, transport, and leisure saw substantial increases.In 1968, food was by far the largest expense, accounting for approximately 35% of weekly income. However, this figure plummeted to around 17% by 2018. Similarly, the proportion of income spent on clothing and footwear halves from 10% to 5%. Spending on fuel and power, household goods, and personal goods also experienced minor declines, each remaining below 10% in both years. Conclusion, leisure and housing attracted a much larger share of family budgets in 2018. Leisure spending more than doubled, percentage about 9% to become the highest expense at roughly 22%. Housing costs also witnessed a significant rise, growing from 10% to just under 20%. Meanwhile, the percentage of income allocated to transport increased moderately from approximately 8% to nearly 14% over the same period.
Band Score 6The chart illustrates information about how families in one countries spent their weekly income in 1968 and in 2018. Overall, rate of food was by far the highest figure among eight categories in 1968, whereas fuel and power represented relatively lower percentage. Leisure was the highest figure in 2018, while personal goods showed a lower score. Food was the most largest figure at 35% in 1968, followed by house and fuel and power at both 10%. However proportions of leisure, transport, personal goods and house hold goods accounted for relatively lower score at around 8%, respectively. Similarly, fuel and power was the lowest at approximately 6%. In terms of percentage of weekly income in 2018. Proportion of leisure was the highest at around 22%, increasing sharply from around 9% in 1968. Similarly, percentage of transport and housing also experienced significant growth from 8% to 14% and from 10% to 19%, respectively. On the other hand, percentage of food and clothing and footwear declined significantly over the period, decreasing around 16% and 5% , respectively.
Band Score 6.5The chart illustrates the average weekly income spent by families in a country between 1968 and 2018. Overall, a larger proportion of weekly income was spent on categories in 1968 than in 2018, with the exception of household goods, for which spending remained unchanged. Additionally, food witnessed the highest expenditure in 1968, while leisure accounted for the largest spending in 2018. Most categories experienced a decline in expenditure from 1968 to 2018, especially food, which stood at 35% in 1968 and dropped dramatically by 17% in 2018. Similarly, fuel and power, and personal goods followed the same pattern but represented a much smaller degree, where the figure halved 2% and roughly 4% respectively. Adversely, a significant upward trend was seen in the spending for housing from 10% in 1968 to approximately 19% in 2018. Leisure observed the highest figure of roughly 22% in 2018, after a remarkable increase of 18%. Slightly lower was that of transport, which surged quickly to 14% over the 50-year period. Meanwhile, spending on clothing and footwear shrank to half, with the figures in 1968 and 2018 being 10% and 5% respectively. Exceptionally, the income spent weekly by families remained unchanged in the category of household goods, which stood at 8%.