
You should spend about 20 minutes on this task. Write at least 150 words.
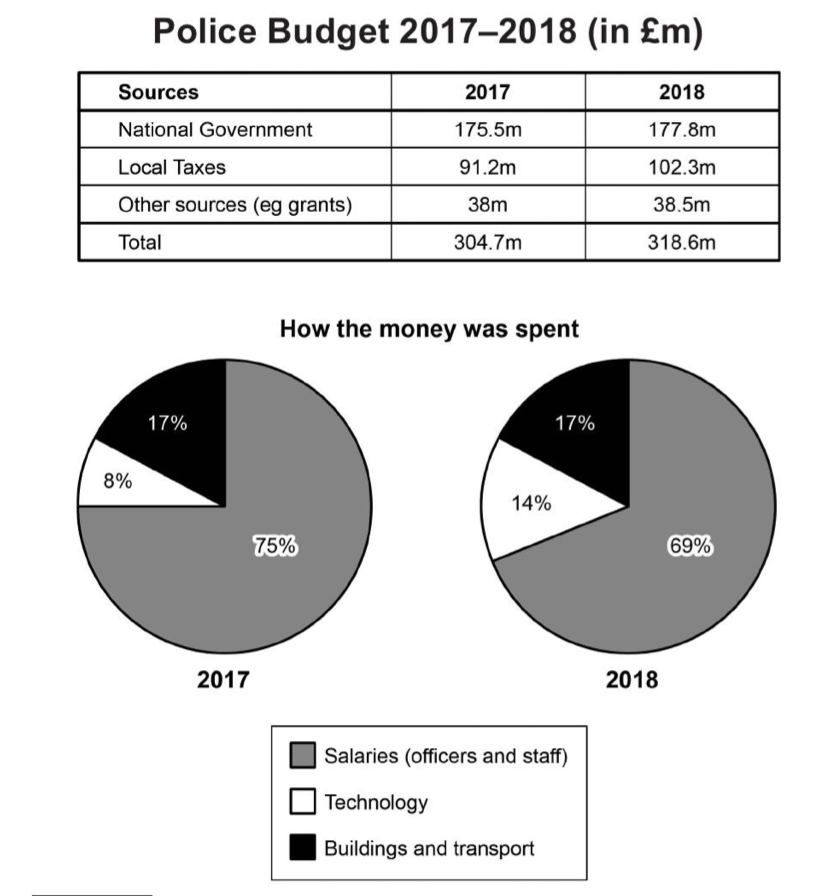
The table and charts below give information on the police budget for 2017 and 2018 in one area of Britain. The table shows where the money came from and the charts show how it was distributed.
Summarise the information by selecting and reporting the main features, and make comparisons where relevant.
Summarise the information by selecting and reporting the main features, and make comparisons where relevant.
The table and pie charts illustrate the sources of police funding and the allocation of expenditure in a British area for the years 2017 and 2018.
Overall, the total police budget experienced a modest increase over the two-year period, with local taxes contributing a greater proportion of the funding. Meanwhile, while salaries remained the largest expenditure category, there was a noticeable shift in spending towards technology.
In terms of revenue, the total police budget rose from £304.7 million in 2017 to £318.6 million in 2018. Funding from the National Government increased slightly from £175.5 million to £177.8 million, while local taxes saw a more significant rise, climbing from £91.2 million to £102.3 million. Other sources, such as grants, remained relatively stable, with only a minor increase from £38 million to £38.5 million.
Regarding expenditure, the distribution of funds varied between the two years. In 2017, the vast majority of the budget, 75%, was allocated to salaries for officers and staff. However, this proportion fell to 69% in 2018, despite a slight increase in the overall budget. In contrast, spending on technology nearly doubled, rising from 8% in 2017 to 14% in 2018. The proportion of the budget dedicated to buildings and transport remained unchanged at 17% over the same period.
In conclusion, while the police force's overall budget grew marginally, the most significant changes were the increasing reliance on local tax revenue and the reallocation of funds towards technological investment, at the expense of personnel costs.
Band Score 6The table and charts illustrate information on the police budget for 2017 and 2018 in one area of britain. The table shows where the money came from. Overall, all of the sources of police budget showed upward trend. Notably, local taxes grew significantly, whereas other sourecs illustarated relatively a small increase. As for how the money was spent, Salaries accounted for large percentages among three categories, while technogy showed lower percentages. Matinal governments increased from 175.5m in 2017 to 177.8 in 2018, making it the highest sources. local taxes experienced significant growth from 91.2m in 2017 to 102.3m in 2018. On the other hand, other sources showed small proportion at 38.5m in 2018. In terms of how the money was spent, Salaries represented a large proportion at 75% in 2017, declining to 69% in 2018. However, technology, buildings and transport accounted for small proportion at 8% and 17%, respectively. technology grew slightly to 14%, while buildings and transport ramained unchanged.
Band Score 5.5The illustrated chart provide information on the police budget for 2017 and 2018 in one area of Britain. In one hand it has clearly shows that the where money came form and the charts show how it was distributed. Overall , it can be observed that the police budget sources inbound to 2017 to 2018 witnessed and increase during the given period. Furthermore, the National Government budget are increased over 175.5m to 177.8m form 2017 to 2018,and also local taxes was 19.2m to 102.3m ,Although other sources has moderately decreased by 38m to 38.5m. From the closer observation of the bar graph, it can be seen that a fairly similar the chart 2017 has 75% and 2018 has 69% money was spent. In the 2017 and 2018 salaries has significantly increased is 75% and 69% .In 2017 the technology has 8% and the other 2018 has 14%.similarly the buildings and transport has same amount which account is 17% shows that in pie chart.
Band Score 5.5The information given is a combination of a table and a chart that gives information about the budget of the police in 2017 and in 2018. Overal the budget of the police was increased between 2017 and 2018 and was spend on technology and coming from a local tax increase. In the table it shows the different kind of sources for the police bugdet in 2017 and in 2018. The budget in 2018 was higher than in 2017 and that increase in budget was mainly coming from an increase in local taxes while the other two sources had a significantly lower raise. When looking at the pie charts of the distribution of spending of the police budget in 2017 and 2018 it stands out that the difference in spending is a six percent swap between salaries of officers and staff and spending on technology. The percentual spending on buildings and transport has stayed exactly the same.
Band Score 6The table illustrates the data on police budget in a particular area of Britain in 2017 and 2018, while pie charts show how that money was distributed in different categories in both years. Overall, it can be seen that all sources of police budget were increased slightly in the given last year with the national government was the major source of funding in both years. In addition, more than a half of money was spent on salaries, whereas spending on technology was far less among all categories. Funding from local taxes was increased significantly from 91.2 million pounds to 102.3 million pounds, while other sources including grants representing approximately similar amount with 38 million pounds. Meanwhile, the national government stayed the main source of funding for police budget in 2017 and 2018 with £175.5 million and £177.8 million respectively. However, in both years, mostly money was spent to provide salaries to officers and staff which made up 75% in 2017, decreased marginally to 69% in 2018. This proportion was followed by buildings and transportation expenses which relatively remain similar in both years at 17%. Similarly, spending on technology was made up 8% in 2017, which rose by 6% in the next year.
Band Score 6The table illustrates information about the sources of police budget in one area of Britain (in million) whereas,the piechart shows how money is distributed in 2017 and 2018. Overall, the total police budget has increased significantly throughout the period with national government begin the largest source of funding. While, salaries was the largest group to spend the police budget. The total police budget experienced a sharp rise during the period, increasing from 304.7m in 2017 to 318.6m in 2018. The national government has been the largest funding in both the years, rising from 175.5m in 2017 to 177.8m in 2018. From 2017 to 2018, the local taxes had increased from 91.2m to 102.3m. Other sources (eg grants) has rised slightly, reaching 38.5m in 2018. However, other sources has only contributed 38m in 2017, which was the lowest funding. Around 75 percent of the budget was spent on the salaries of officers and staff in 2017, which was the highest expenditure. It has slightly decreased to 69 percent in 2018, but it remained dominant. It is evident that 17 percent of the budget was accounted for technology in both the years. Buildings and transport was least spent area in both the years, whereas it has increased from 8 percent in 2017 to 14 percent in 2018.
Band Score 5.5The table and pie charts illustrates the sources and expandture of police budget in an area of Britain in one year. The majority of the portion of money came from National Government with gradual increase in year 2018 from local taxes. A major amount was spent on salaries leaving a very small portion spent on things like technology, buildings and transportation. The national government contributed the major portion of money in both years. Despite the fact local taxes contributed 102.3 million pounds in 2018 as compared to 91.2 million pounds there was not a very big difference in total amount 304.7 million in 2017 and 318.6 million in 2018. where as the budget contribution from other sources for example grants remain in close proximity in both years with just 500 thousand pounds increase in year 2018. Where expendeture on buildings and transport remained same at 17% in both years, the pie chart shows 6% increase in terms of technology. The big portion of money was spent on salaries of officers and staff members in both years with the decrease of 6% in year 2018 which was used in technology in the same year.
Band Score 6The charts provide information about the Police Budget in one area of Britain in 2017 to 2018, including how the money was spent. Overall, National Government accounted for the largest proportion of the Police budget, while other resources were by far the smallest portion of the police budget. In addition, the total budget. generally increased over the year. Looking first at the sources of the Police Budget, the National Government is the highest source of the budget with around 175.5 million in the year 2017 and slightly increased to 177.8 million in the year 2018.Local Taxes made it the second source of the national budget with 91.2 million in 2017 which also increased in the year 2018 to 102.3 million. The smallest source of budget such as grants is approximately 28 million pounds in 2017 and steadily increased in 2018 to 310.6 million pounds. Finally, the percentage of the budget spent on the salaries of the officers and staff have 75 percent of the total expenditure in the year 2017 and slightly decreased in the year 2018 with only 69 percent.By contrast, technology is accounted for only 6 percent in the year 2017 and rose significantly in the year 2018 to 14 percent.While buildings and transportation remained the same in year 2017 to 2018 with 17 percent.
Band Score 6The given table presents the sources of money for police budget in 2017 and 2018, and the pie chart shows how the money was distributed for giving salaries, technology costing and for transportation and building expenses. From the table it can be found that total budget has been slightly increased from 2017 to 2018 and it raised 304.7m to 318.6m. The fund comes from National government, Local taxes and other sources like grants and for bigger budget in 2018 the outcome from all sources increased. The large portion of budget amount come from National government in both years and it was 175.5m and 177.8m respectively. Compares to other sources, money from local taxes mostly increased from 91.2m to 102.3m over the year of 2017 to 2018. Other sources of income for police budget remain almost same in both the years and it was 38m and 38.5m. The expenses for building and transport remained stable and it is accounted for 17% in both years. The budget for technology grew from 8% to 14% and the deduction has been done from salary budget between 2017 and 2018.
Band Score 6The table and chart illustrate the in formation on the police budget for 2017 and 2018 in one of are in UK, while charts show where the money comes from. Overall, lac taxes experienced significant growth over the period, whereas national government and other sources grew slightly. Moreover, The percentage of expenditure for technology increased, while salaries in declined slightly and building and trams port remained unchanged. In terms of police budget, national government was the highest figure, standing at 175.5m in 2017. It then increased slightly to 177,8m. Local taxes also showed an upward trend, soaring from 91.2m in 2017 to 102.3m in 2018. Similarly other sources grew from 38m to 38.5m. As for expenditure, salaries accounted for largest proportion at 75% in 2017. It eventually fell to 65% in 2018. However, percentage of technology showed a growth over the period from 8m in 2017 to 14% in 2018. Building and transport remained unchanged over that period at 17%.