
You should spend about 20 minutes on this task. Write at least 150 words.
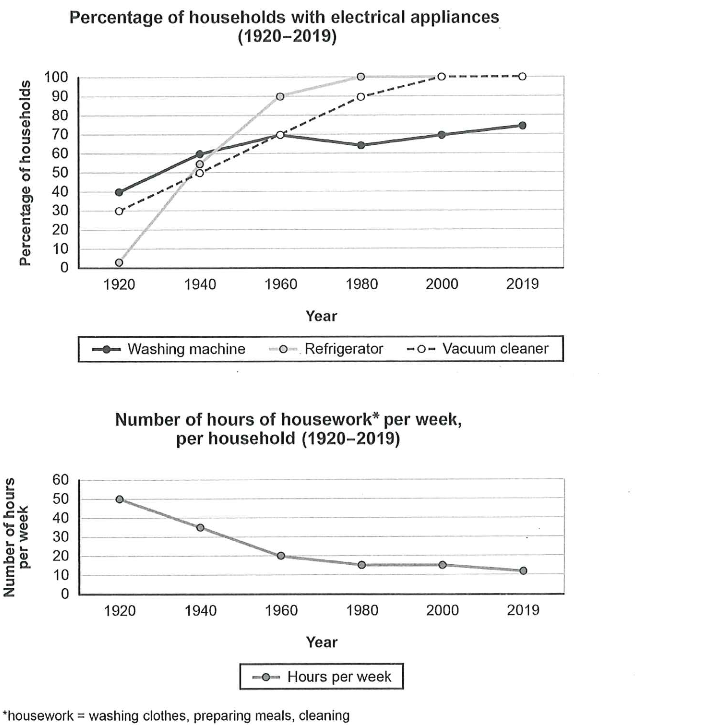
The charts below show the changes in ownership of electrical appliances and amount of time spent doing housework and households in one country between 1920 and 2019.
Summarize the information by selecting and reporting the main features, and make comparisons where relevant.
Summarize the information by selecting and reporting the main features, and make comparisons where relevant.
The line graphs illustrate the percentage of households owning three different electrical appliances and the average number of hours spent on housework per week in one country over a period of 100 years, from 1920 to 2019.
Overall, it is clear that ownership of all three appliances increased significantly over the period, while the time spent on housework decreased dramatically. Refrigerators and vacuum cleaners became nearly universal, and washing machines also became very common, leading to a substantial reduction in household chores.
In 1920, the ownership of electrical appliances was relatively low. Only 40% of households had a washing machine, while refrigerator and vacuum cleaner ownership was much lower, at 0% and 8% respectively. Over the next few decades, ownership of all three appliances rose steadily. By 1940, washing machine ownership had reached 60%, while refrigerators and vacuum cleaners had increased to 25% and 33% respectively.
The most dramatic growth occurred between 1960 and 1980. By 1980, refrigerator ownership had surged to 100%, and vacuum cleaner ownership had also reached almost 100%. Washing machine ownership continued to rise, reaching 65% by 1980 and peaking at around 75% in 2000, before declining slightly to 70% in 2019.
In contrast, the number of hours spent on housework per week fell sharply. In 1920, households spent 50 hours per week on housework, but this figure dropped to just 35 hours by 1940. The decline continued steadily, and by 1980, the average number of hours had fallen to 15 per week. By 2019, the figure had reached a low of only 10 hours per week.
In conclusion, the increased ownership of electrical appliances directly correlated with a significant reduction in time spent on housework, with the most marked improvements occurring between 1960 and 1980.
Band Score 6The first chart illustrates the percentage of households with electrical appliances while second chart demonstrates the number of hours of housework per week, per household between 1920 and 2019. Overall, in first chart the percentage rates of all electric appliances are in growth but their increment figure is distinct. Alongside in second chart the number of housework hours are decreasing gradually. In first chart, the percentage of refrigerator is starting from zero and steadily in growth from 1920 for four decades and then the figures remain constant while in case of vacuum cleaner the steady growth is for eight decades while the percentage rates of washing machine are starting from 40 figure and fluctuating slightly throughout the whole duration. In second chart the number of housework hours are decreasing steadily from 50 hours per week to 20 hours weekly between 1920 and 1960 and after this figures remain constant util 2019.
Band Score 5.5The line graph illustrates data about the changes in ownership of electrical appliances and amount of time spent doing housework and households in one country between 1920 and 2019. Overall, over the years, ownership of all three appliances increased. It's clearly the highest percentage of households electrical vacuum cleaner, and lowest percentage of households electrical appliance is refrigerators. According to the washing machines were the most common of the three electrical appliances in 1920, with ownership reaching 40% of households. this number then increased to about 75% by 2019, with only a small dip in 1980. Nearly a third of households owned vacuum cleaners in 1920. First fell significantly from 50 to 15 hours per week per household between 1920 and 1980. However this ratio experienced a downward trend and reached just over 10 hours per week by 2019.
Band Score 5.5The line graph depicts the percentage of households with electrical appliances and the total number of hours in operation per week from 1920 to 2019. Overall, it can be clearly seen that having electrical appliances in the house is increasing throughout the period, while the number of hours per week for use them experienced a downward trend. In 1920, there were negligible house had a refrigerator, and 30% and 40% household with washing machine and a vacuum cleaner. This number continue grow and reached 100% refrigerator, 90% vacuum cleaners, and after fluctuating, almost 65% house had these appliances in 1980. By 2019, the percentage of households with a vacuum cleaner had risen slightly and reached at 75%, whereas the other two appliances had with 100%. Almost 50 hours of housework per week by the family in 1920, which fell to 20 hours in 1960. However, this ratio experienced a downward trend and reached just over 10 hours per week by 2019.
Band Score 5.5The line graph illustrate the percentage of household electrical appliances the changes in ownership and the number of time spent doing housework in one country in 1920 and 2019. It is clear that the highest percentage of household electrical Vacuum cleaner, and lowest percentage of electrical Refrigerator. In addition, all electrical machine increased both of years. Whereas, the number of housework of hours declined over the period. According to the line graph, the highest proportion of electrical Vacuum cleaner stood at 30% in 1920. This figure increased gradually and reached to over 100% in 2019. Meanwhile, The Refrigerator started to 0 % in 1920, this figure rose sharply to 100% in 2000. In addition, Washing machine climbed from to 40% to 70%, respectively, in 2019. On the other hand, the highest number of housework per week was 50 hour in 1920. This figure first fell to 32 hour in 1940 and it again dropped to 20 hour. This figure in 1980 remained unchanged in both 1980 accounted for 10%.
Band Score 6The given line charts illustrates the change in percentage of household with electrical appliances(washing machine, refrigerator and vacuum cleaner) and number of hours housework(washing cloths, preparing meals, cleaning) per week per household from the year 1920 to 2019. Overall, we can clearly see the steep growth of percentage of houses with electrical appliances. And it is obvious from the chart that increase in household with electrical appliances is directly affecting the number of housework hours per week since it is decreasing gradually each ear. According to first line graph, in the year 1920 household with refrigerator was around 0% which had had a exponential growth for next 3 decades reaching around 100% in 1980 and then maintaining the same status till the end. However there was 30% and 40% of household have had vacuum cleaner and washing machine in the year 1920 which showed constant growth both reaching 70% in the year 1960 but after that the household with washing machine show slight decline in following decades but the there there was constant growth in house with vacuum cleaner reaching 100% in the year 200 and maintaining that figure till 2019. On the second line graph, we can clearly see that people were spending around 50 hours a week doing housework in the year 1920. With the increase in the percentage of household with electrical appliances, number of hours is decreased by more than half by year 1980 reaching 20 hours per week. After that the hours remained almost similar for few decades reaching around 10 hours per week in the year 2019.
Band Score 7The line graphs illustrate changes in the percentage of households owning electrical appliances (washing machines, refrigerators, and vacuum cleaners) and the weekly hours spent on housework in one country from 1920 to 2019. Overall, ownership of all three appliances increased over the period, with refrigerators and vacuum cleaners reaching near-universal adoption by 2019, while washing machines remained less common. Concurrently, the time spent on housework declined sharply, stabilizing after 1960. Regarding refrigerators, household ownership rose dramatically from 0% in 1920 to 100% by 1980. Vacuum cleaner ownership also increased substantially, reaching 100% in 2000, though the growth rate was less steep. In contrast, washing machine ownership grew steadily from around 40% in 1920 but plateaued at just over 70% in 2019. The data show a clear inverse relationship between appliance ownership and housework hours. In 1920, weekly housework averaged 50 hours, but this fell sharply to 20 hours by 1960, then gradually declined to 10 hours per week in 2019.
Band Score 6.5The line charts illustrate the change in the percentage household ownership of electrical appliances and the change in the hours spent per week on household over a century. Overall, the percentage of both vacuum cleaner and refrigerator has increased over the given time period of the data. The washing machine has the lowest percentage household ownership as of 2019. The number of hours spent on housework has sharply declined since 1920 and stabilized since 1960. With regards to the refrigerator, the percentage household ownership skyrocketed since 1920 and hit a 100 percent in 1980. The vacuum cleaner also saw a similar rise, but the rate of increase was less profound, with the percentage household ownership hitting 100 in 2000. While the ownership of the washing machine also increased from 1920, it has yet to penetrate all the households, with the percentage ownership sitting just above 70 percent. The data indicates a negative correlation between household ownership of appliances and number of hours of housework since the number of hours spent per week were the highest in 1920 at 50 hours per week and then sharply declined to 20 hours per week. This decline stabilized over the years to 10 hours per week in 2019.
Band Score 6The charts illustrates the changes in ownership of electrical appliances and amount of time spent doing housework and households in one country between 1920 and 2019. Overall,the percentage of households increase rapidly.Beside,The number of hours of housework per week from 1920 to 2019 is decreasing significantly. In the chart which shows the percentage of households with electrical apppliances, we can see that the washing machine line raised dramatically from 1920 to 1960 and peaked at 1980,2000 and 2019.The vacuum cleaner line had nearly the same raise as the washing machine and got the highest point at 2000 and 2019.Althought the refrigerator could not get the rapid increase and had a lightly drop between 1960 and 1980 but it was also increased and peaked at around 75 percent. Move to the chart which illustrates number of hours of housework per week,per household.It had only decrease.The hours of housework per week had dropped rapidly from 1920 to 1960 and get the lowest point at 2019 with nearly 10 hours.
Band Score 7The charts illustrate how the percentage of households owning three types of electrical appliances changed, alongside the average amount of time spent on housework per week in a specific country between 1920 and 2019. Overall, it is clear that more households bought electrical appliances over the period, with refrigerators and vacuum cleaners reaching maximum ownership. Meanwhile, the number of hours people spent doing housework showed a significant decrease. Looking at the first chart, in 1920, only nearly 0% of households had a refrigerator, but this figure grew rapidly and reached 100% by 1980, remaining stable until 2019. Similarly, the percentage of vacuum cleaners started at 30% in 1920, then increased steadily to 100% in 2000 and stayed at this peak at the end of the period. In contrast, washing machines were the most popular appliance in 1920 at 40%. However, its ownership rose more slowly, fluctuating slightly between 1960 and 1980, before ending at around 75% in 2019. Turning to the second chart, households spent a lot of time on housework in 1920, at 50 hours per week. This number dropped sharply to 20 hours in 1960. After that, the figures decreased more slowly and reached the lowest point of just over 10 hours in 2019.