
Summarize the information by selecting and reporting the main features, and make comparisons where relevant.
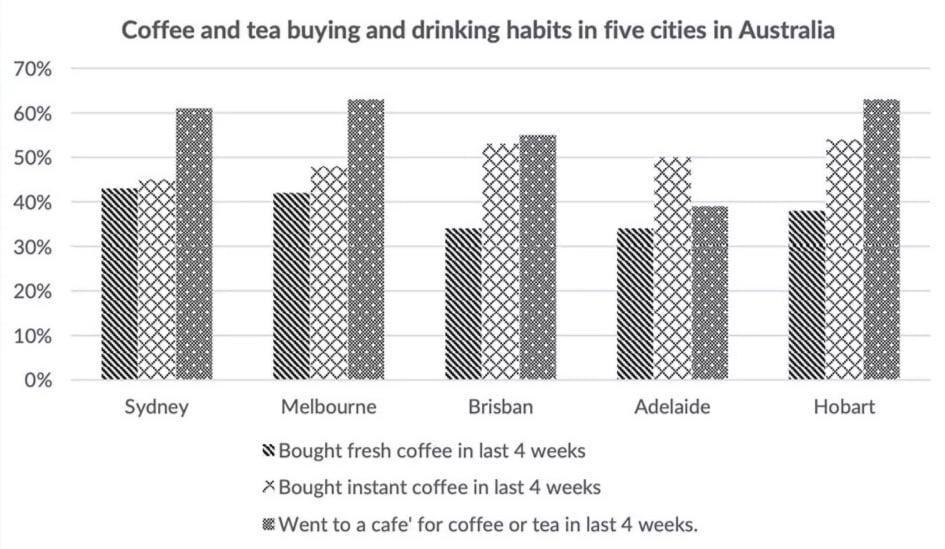
The bar chart illustrates the results of a survey conducted in five Australian cities—Sydney, Melbourne, Brisbane, Adelaide, and Hobart—regarding residents' coffee and tea consumption habits over the preceding four weeks, categorised into three distinct behaviours: buying fresh coffee, purchasing instant coffee, and visiting a café for coffee or tea.
Overall, visiting a café for coffee or tea was the most popular activity across all five cities, while purchasing instant coffee was generally more common than buying fresh coffee, with some notable exceptions.
In terms of café visits, Hobart recorded the highest proportion, with just over 60% of respondents reporting having visited a café for coffee or tea in the previous month. Sydney and Melbourne followed closely, both at around 60%, while Brisbane and Adelaide had slightly lower figures, at approximately 55% and 50% respectively.
Regarding instant coffee consumption, this habit was most prevalent in Adelaide and Brisbane, where approximately 55% of respondents had purchased instant coffee. Melbourne and Hobart showed similar levels, at around 50%, while Sydney had the lowest proportion, at roughly 45%. Interestingly, Sydney, which had the lowest instant coffee consumption, recorded the highest percentage for fresh coffee purchases, at nearly 45%. In contrast, Adelaide and Brisbane, where instant coffee was most popular, reported the lowest fresh coffee buying rates, at approximately 35% each.
It is also worth noting that fresh coffee purchases were consistently the least common activity in four of the five cities, with the only exception being Sydney, where the figure was comparable to instant coffee consumption. Melbourne and Hobart showed relatively balanced patterns across all three categories, whereas Adelaide and Brisbane exhibited a clearer preference for instant coffee over fresh coffee.
Why this answer scores Band 7.5:
| Criteria | How the sample meets Band 7.5 requirements |
|---|---|
| Task Achievement | Fully addresses all data points and categories. Provides a clear overview and makes relevant comparisons across cities and behaviours. Highlights exceptions and trends effectively. |
| Coherence & Cohesion | Excellent paragraph structure: introduction → overview → body paragraphs with logical grouping. Uses a wide range of cohesive devices naturally: Overall, In terms of, Regarding, Interestingly, In contrast, It is also worth noting. |
| Lexical Resource | Wide range of precise vocabulary: illustrates, conducted, preceding, categorised into distinct behaviours, prevalent, comparable, exhibited, consistently. Avoids repetition of basic terms. Uses appropriate synonyms for "percentage" (proportion, figure, rate, level). |
| Grammatical Range & Accuracy | Wide variety of complex structures: relative clauses (which had the lowest...), participle phrases (regarding residents' coffee...), comparative structures (more common than, comparable to, approximately), and passive voice (were reported, was recorded). Virtually no errors. |
What pushes this to Band 7.5 (compared to Band 7.0):
| Aspect | Band 7.0 | Band 7.5 (this sample) |
|---|---|---|
| Overview | Basic summary | Insightful summary with clear ranking (most popular, generally more common, with exceptions) |
| Data grouping | Describes each city sequentially | Groups logically (café visits together, instant coffee together, fresh coffee together) |
| Comparisons | Simple comparisons | Sophisticated comparisons (Adelaide and Brisbane showed a clearer preference for instant coffee over fresh coffee) |
| Vocabulary | Good range | Wider range with precision (prevalent, comparable, exhibited, consistently) |
| Grammar | Good control | Confident use of varied structures |
Key features of Band 7.5+ Task 1 demonstrated:
1. Strong overview with ranking:
"Overall, visiting a café for coffee or tea was the most popular activity across all five cities, while purchasing instant coffee was generally more common than buying fresh coffee, with some notable exceptions."
2. Logical grouping of data:
Instead of describing Sydney, then Melbourne, then Brisbane, etc., the essay groups by behaviour type:
Café visits (all five cities)
Instant coffee (all five cities)
Fresh coffee (all five cities with comparisons)
3. Sophisticated comparisons:
"Interestingly, Sydney, which had the lowest instant coffee consumption, recorded the highest percentage for fresh coffee purchases, at nearly 45%." (Shows contrast clearly)
4. Identifying patterns and exceptions:
"It is also worth noting that fresh coffee purchases were consistently the least common activity in four of the five cities, with the only exception being Sydney..."
5. Precise data language:
approximately (not just "about")
recorded the highest proportion
followed closely
slightly lower figures
Quick checklist for Band 7.5+ Task 1:
Clear introduction paraphrasing the task
Strong overview paragraph highlighting key trends
Logical grouping of data (not just listing)
Accurate data reporting with approximations
Relevant comparisons across categories
Identification of exceptions and patterns
Wide range of precise vocabulary
Complex sentence structures used naturally
Virtually no grammatical errors
At least 170-190 words
Comparison: Band 6.5 vs 7.5 (same task)
| Aspect | Band 6.5 | Band 7.5 (this sample) |
|---|---|---|
| Overview | "The chart shows coffee habits in five cities." | "Overall, visiting a café... was the most popular activity, while purchasing instant coffee was generally more common than buying fresh coffee, with some notable exceptions." |
| Data description | "Sydney had 45% for fresh coffee." | "Sydney... recorded the highest percentage for fresh coffee purchases, at nearly 45%." |
| Comparisons | "Brisbane was lower than Melbourne." | "Brisbane and Adelaide showed similar levels, at around 50%, while Sydney had the lowest proportion, at roughly 45%." |
| Vocabulary | show, have, about | illustrates, recorded, exhibited, prevalent, consistently, comparable |
| Grammar | Simple sentences | Complex sentences with multiple clauses |
Additional tips for Band 7.5+ in Task 1:
Use a range of approximation language:
approximately, around, roughly, nearly, just over, just under, slightly more than
Vary reporting structures:
The chart illustrates / It is evident that / Interestingly, / According to the data
Use comparative forms effectively:
more common than, comparable to, similar to, followed by, in contrast to
Identify the most significant features:
The highest, the lowest, the most popular, the least common, exceptions
Avoid repetition of "percentage"
proportion, figure, rate, level, number
Band Score 6The bar chart above illustrates survey outcomes of purchasing and drinking either tea or coffee in Sydney, Melbourne, Brisban, Adelaide, and Hobart. Overall, people who went to a cafe for a beverage (tea or coffee) in past month in both Melbourne and Hobart showed highest equal percentage whereas people who bought fresh coffee last month accounted same least values for both Brisban and Adelaide. However, the percentage of customers who bought fresh coffee, instant coffee or went for a cafe for tea or coffee in past month has fluctuated between five Australian cities. In Sydney, around 61% of consumers went to a cafe for either tea or coffee recording highest percentage for that city, while people who bought fresh coffee in past month approximately 42% which showed the least value. Interestingly, people who went to acafe for coffee or tea in Melbourne and Hobart raised to around 63% which is the highest among five cities. In contrast, Brisban accounted nearly 55%, while around 39% recorded for Adelaide. Additionally, people who bought instant coffee in previous month recorded least percentage around 45% in Sydney nearly 48% in Melbourne and exactly 50% in Adelaide. However, the usage of instant coffee in past month for both Brisban and Hobart showed same percentage around 53% Moreover, around 35% of customers bought fresh coffee in both Brisban and Adelaide in past month. People in Melbourne used fresh coffee around 42% followed by around 38% of usage in Hobart in previous month.
Band Score 6The bar chart illustrates the outcomes of a survey regarding purchasing and consumption preferences of caffinated beverages among individuals in Sydney, Melbourne, Brisban, Adelaide and Hobart. Overall, going to the cafe for coffee and tea was the most popular among people in last four weeks in Sydney, Melbourne, Brisban and Hobart. However, buying instant coffee was more prefered in Adelaide. Firstly, in Melbourne and Hobart appoximetly 63% people visited cafe, followed by approximetly 61% people of Sydney and just over 50% individuals in Brisban going to cafe. In contrast, going out for coffee or tea was less popular in Adelaide with just under 40% people visiting cafe. One the other hand,
Band Score 6The graph illustrates the output of a survey in five Australian Cities on people's tendency to have tea and coffee. The figure remains relatively constant, maintaining a steady level with a marginal difference. In Sydney, most of the people tend to buy more fresh coffee compared to instant coffee, while the percentage of people drinking at restaurants is slightly lower, since 40 % of them like to sit down. Melbourne also witnesses similar consumer patterns compared to Sydney. In Brisbane, there is quite a difference in the trend because here not many citizens like to drink tea or coffee at a cafe. Additionally, Adelaide shows a slightly more vibrant scene in the case of all three aspects, such as drinking coffee or tea, buying fresh coffee, and instant coffee. Here, around 38% of dwellers show interest in buying coffee, while half of the citizens like to buy instant coffee. However, Hobart people have the highest interest in buying fresh coffee. Besides, they also love to have instant coffee, whereas the smallest proportion goes to cafes to drink tea or coffee. Overall, the graphic shows the greatest demand for buying fresh coffee in all cities.
Band Score 5This chart shows the results of survey about the people's coffee and tea buying and drinking habits in five Australian cities. In every cities their are different numbers People loves to drink fresh coffee more then any other coffee. Melbourne and Hobart have the highest number of fresh coffee bought in last 4 weeks. Due to facilities of getting delivery to home people are getting less active to go to cafe and buy tea and coffee. IN Sydney, People had buy fresh coffee which is 62 percent and that is more then instant coffee, after that people had bought instant coffee buy 45 percent and at last people are buying coffee and tea buy going to cafe at 42 percent. In Melbourne people are had bought fresh coffee at 65 percent which is the most highest in this chart and higher then any other cities except Hobart and the number of people buying instant coffee is at 48 percent ,at last people buying by going to cafe are less like Sydney which is at 42 percent. Surprisingly in BRISBAN the number of people buy instant coffee is higher then any other cities except HOBART which is at 53 percent. People had bought fresh coffee at 55 percent and at last the number people going to cafe to buy tea and coffee are less then any other cities which is at 35 percent except ADELAIDE. IN ADELAIDE and HOBART has the number of people buying fresh coffee is at 39 percent and 62 percent, where the number of HABART is higher then other cities like SYDNEY. People buying instant coffee is at 50 percent and 55 percent. At last the number of people buying coffee and tea by going physically to cafe is at 35 percent and 38 percent.
Band Score 7The graph illustrates the value of goods that Australia imported from China and those exported to China from Australia, accompanied by another graph giving information about types of goods imported from China between 2003 and 2004. Overall, the value of both imported and exported goods rose consistently over the timeframe, with the former marginally ahead. Regarding types of goods imported from China, all types of goods experienced an upward trend, with the notable exception of cotton, which remained stable throughout. Notably, the most pronounced growth was observed in the figure for telecommunication equipment. Looking first at the value of goods which Australia imported from China and those exported to China: both groups of good followed somewhat similar patterns throughout the timeframe, with the imported goods increasing gradually by roughly $3 billion in every year, ultimately concluding the period at just $40 billion from around $20 billion. Meanwhile, the figure for exported goods also saw a moderate rise yet less significant over the years, reaching a peak of around $30 billion from $10 billion and remaining slightly behind the figure for imported goods. Turning to types of goods imported from china in the years 2003 and 2004: the proportion of telecommunication equipment stood at roughly $3 billion in initial year – a figure which more than doubled in the next year ($8 billion) – the highest figure in the entire dataset. This was closely followed by the share for toys/sports equipment which recorded an almost threefold increase from just $2 billion to over $7 billion. Meanwhile, computers and furniture represented near-identical figures over the years, each accounting for approximately $5 billion in 2003 and $6 billion in 2004. The proportion of cotton, on the other hand, did not see any significant changes throughout the period, averaging at $4 billion and trailing far behind other figures..
Band Score 6The graph displays collected data in a study about buying coffee or tea and drinking habits of the residents in five Australian cities in last 4 weeks. Overall, it is clear that except from Adelaide, more people went to cafe for having either or tea that buying them. In Adelaide, going coffee and buying instant coffee similarly popular . Most dwellers in Melbourne, Sydney, Brisbane and Hobart visited shops for coffee and tea. There percentages respectively, nearly 62%,60%,55% and 63% where as this percentage was less than 50% in Adelaide. Among these five cities except from Hobart and Brisbane, buying instant coffee was roughly 50% ,however these two showed slightly higher percentage nearly 55%. In comparison, the percentage for buying fresh coffee in last four weeks was less 45% in all lections. Brisbane and Adelaide, represented lower percentage of having fresh coffee that was around 33%.
Band Score 6The bar chart illustrates the result of a study of people's choice among buying coffee or tea and drinking habits in five different towns in Australia in last 4 weeks. Overall, it is clear that the percentage for the people who liked to go coffee shops instead of buying coffee or tea was higher in almost every cities except from Adelaide. In Sydney, Most people prefer going café for having coffee or tea, the percentage was more 60% .Similar drinks preference was found in Melbourne and Hobert. Almost 62% residents of these cities went to restaurant for drinking either coffee or tea which is the higher figure of this chart. In regarding to the percentage of buying fresh coffee in last 28 days was similar in Sydney and Melbourne with around 43% where the percentage in Hobart was slightly lower than these two. However the choice of consuming instant coffee varied among these there cities. Sydney and Melbourne accounted for almost 45% and 48% respectively and the Hobart showed a rise near 55% in this habit during last two couple of weeks. In Brisbane and Adelaide the habits of drinking was distinguish. During last 4 week, about 53% and 54% peoples bought fresh and instant coffee . But the percentage was lower for people who went to cafe for drinking tea and coffee which was nearly 35%. Adelaide's people mostly prefer to have instant coffee than other two choices . Half of the Adelaide's people prefer instant coffee. The other two habit range from near 32% to near 48%.
Band Score 6.5The bar chart illustrates the proportion of the outcomes of a survey about people's coffee and tea purchasing and consuming preferences in five Australian cities. Overall, people consuming coffee or tea in last four weeks in a cafe was highest in Sydney, Melbourne, Brisban and Hobart, whereas people in Adelaide prefers instant coffee rather than having a tea or coffee in a cafe. Notably, in last four weeks, buying fresh coffee was the least prefered by individuals of all five cities in Australia. In Sydney, Melbourne and Hobart about 60% of people went to a cafe for coffee or tea in last four weeks. Likewise, about 55% and 40% of individuals from Brisban and Adelaide respectively, went to a cafe for coffee or tea. About 52% from Brisban and Hobart brought instant coffee which was the highest among other three cities. Additionally, approximately 50% of other three cities brought instant coffee in Australia. About 40% people from Sydney and Melbourne bought fresh coffee in last 4 weeks, which was highest among other cities. Similarly Brisban, Adelaide and Hobart bought fresh coffe of about 38% in last 4 weeks.
Band Score 6.5The bar chart illustrates the proportions of residents in five Australian cities Sydney, Melbourne, Brisbane, Adelaide, and Hobart who engaged in three distinct tea and coffee purchasing and consumption habits over the four weeks prior to the survey. Overall, patronizing a cafe for coffee or tea emerged as the most popular practice across the majority of cities , whereas buyinf fresh coffee was consistently the least favored option . furthermore , Adelaide stood out as the sole exception to the general trend , being the only city where instant coffe purchases outstripped all other categories . Cafe visits were exceptionally prevalent in melbourne and hobart, with both cities recording the highest figure at aprroximately 63 percent . Sydney followed closely , with roughly 61 percent of its population visiting a cafe , while the percentage for Brisbane was slightly lower at arround 53 percent .
Band Score 6The given bar chart illustrates coffee and tea buying and drinking habits in Sydney, Melbourne, Brisbane, Adelaide and Hobart. Overall, highest percentage of people went to a café for tea or coffee where as least percentage bought fresh coffee in last four weeks. In Melbourne and Hobart approximately 63% of people went to a café for a beverage, while around 35% in Brisbane and Adelaide bought fresh coffee in last four weeks. However, this was the least percentage compared to overall beverage intake for past four weeks. In Sydney nearly 42% of people bought a fresh coffee followed by around 43% of people brought instant coffee in last month. Interestingly, compared to above two categories 61% of people in Sydney had tea or coffee in a café. In addition, people in Melbourne and Hobart had around 47% of instant coffee in last month followed by around 52% in Brisbane. Moreover, people who went to a café in past one month for a coffee or a tea fluctuated over the cities in Australia, While highest recorded around 63% in Melbourne and Hobart followed by around 53% in Brisbane and 50% in Adelaide. In comparison with customers who fresh coffee over last month, people who went to a café for a tea or coffee showed higher percentage. However, least percentage bought fresh coffee while nearly 43% and 42% showed for Sydney and Melbourne respectively.
Band Score 5.5The bar chart illustrates the results of Survey individuals coffee and tea buying and drinking habits in five cities from Australia. Overall, the cities Melboume and Hobart, coffee and tea was the most popular choosed by the citizens in last four weeks, followed by people from Brisban and hobart bought instant coffee in last weeks, while the people who bought fresh coffee in last week from Adelaide was the lowest. The citizens from Melboume and hobart prefered went to a cafe for cooffee or tea in last weeks was the most popular at least 63% both of them, while people from Sydney l
Band Score 6.5The bar graph illustrates the findings of a survey which showing the proportion of people who bought and drank coffee and tea in the last four weeks in five different cities (Sydney, Melbourne, Brisbane, Adelaide, and Hobart) in Australia. Overall, it can be seen that the majority of people went to cafe for coffee and tea, while buying instant coffee was generally more common than fresh coffee in all cities. In Sydney, Melbourne, and Hobart, the proportion of people who went to a cafe for coffee and tea was similar, at just 60%, while the figure for people who bought instant coffee was approximately 45% in Sydney and Melbourne, and 55% in Hobart. In those three cities the proportion of people who bought fresh coffee was lower at around 42%, in Sydney and Melbourne and 38% in Hobart. Around 35% of people bought fresh coffee in Brisbane, while the figure reached around 52% for other two categories. Adelaide showed a different pattern, fresh coffee buyer was accounted for around 35%, which was followed by people who went to a cafe at around 38%. In contrast, people who bought instant coffee had the highest proportion at 50%.
Band Score 6The bar chart illustrates the findings of a survey regarding coffee and tea consumption and purchasing habits among residents of five cities across Australia. It is evident that, aside from Adelaide, the percentage of people who visited a cafe in the past month exceeds both those who bought fresh coffee and those who bought instant coffee during the same period. Additionally, in all the given cities, the proportion of individuals who bought fresh coffee is fewer than those who bought instant coffee. Except for Adelaide, in all other cities, more than half of the population has visited a cafe in the past month. Hobart and Melbourne have the highest percentage of cafe visitors with nearly 65%. In Adelaide, the proportion of visit cafes, both constituting about half of the population. The percentage of individuals who have bought fresh coffee has always been less than 45%, regardless of the city. In Adelaide and Brisbane, the survey indicates that this percentage is the lowest, at less than 35%. Sydney has the least discrepancy between the percentages of instant coffee buyers and fresh coffee buyers according to the survey.