
You should spend about 20 minutes on this task. Write at least 150 words.
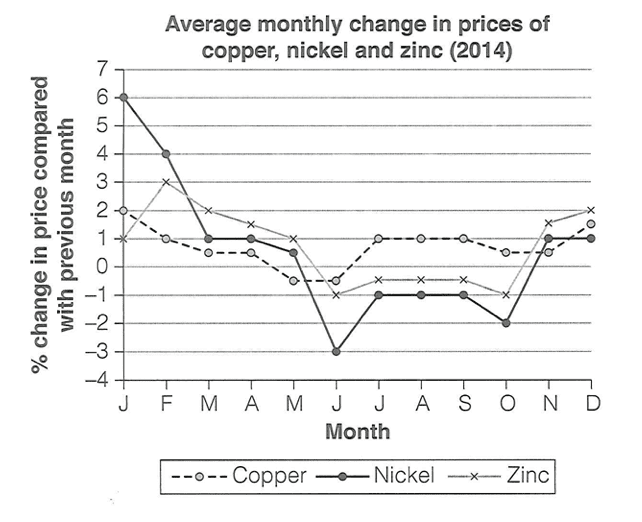
The graph below shows the average monthly change in the prices of three metals during 2014.
Summarise the information by selecting and reporting the main features, and make comparisons where relevant.
Summarise the information by selecting and reporting the main features, and make comparisons where relevant.
The line graph illustrates the average monthly fluctuations in the prices of three different metals—copper, nickel, and zinc—throughout the year 2014. The figures are presented as percentage changes from the previous month.
Overall, it is evident that all three metals experienced considerable volatility over the twelve-month period, with copper exhibiting the most dramatic fluctuations. While nickel and zinc prices remained relatively stable in the latter half of the year, copper showed a notable recovery after a sharp mid-year decline.
In the first quarter of 2014, all three metals started with positive growth. Copper began with a 6% increase in January, followed by a 4% rise in February, before moderating to 1% in March. Nickel also showed strong growth, peaking at 3% in February, while zinc remained relatively subdued, fluctuating between 0.5% and 1% during the same period.
However, from April onwards, a downward trend became apparent. Copper prices experienced a steady decline, falling from 0.5% in April to a low of -3% in June, representing the sharpest drop among all metals. Similarly, nickel turned negative in May and June, though the decline was less severe, reaching -1%. Zinc also dipped into negative territory from May to August, hovering around -1%.
The second half of the year saw a divergence in trends. Copper recovered significantly, rising to 0.8% in July and remaining stable at that level for the next three months before tapering off to zero by November. In contrast, nickel fluctuated between -0.8% and 0% from July to October before stabilising at zero for the remainder of the year. Zinc, after a negative spell, rebounded to 1% in October but also ended the year at zero.
In conclusion, copper was the most volatile metal throughout 2014, with a sharp drop and subsequent recovery, while nickel and zinc showed more moderate fluctuations and greater stability in the final months.
Band Score 6The line graph illustrates the changes in the cost of three metals in 2014. Overall, it is evident that Zink experienced an upward trend despite its fluctuation, whereas Nickel declined over the period. in addition, Copper recorded a slight decrease. At the beginning of the period, Copper stood at 2% compared with Zinc at 1%, thereafter, Copper fell steadily to about -0.5% in the middel of the year before recovering slightly towards the end of the period, meanwhile, Zinc rose gradually to 3% in February, after that it decreased back and then fluctuated before reaching its peak at 2% in the end of the year. Turning to Nickel , its figure had a dramatic decline going from 6% in the beginning of 2014 to -3% in the middel of it, then had a slight fluctuation until it settled at 1%. by contrast , Copper remained relatively stable, hovering around 1 and 2 percent, by the end of the period , Nickel finished below Zinc.
Band Score 5.5The line graph illustrates the average monthly change in the costs of cooper, nickel, and zinc throughout 2014. Overall, nickel witnessed a dramatical drop over the given period , while zinc and copper fluctuated over the year. Looking at the the price of copper in detail, it declined significantly until June, falling from 6% to -3%. After that, it remained steady for three months after increasing by 2% in July, accounting for 1% in December. Regarding copper, it decreased moderately until June, making up just under 0%. Afterwards, it experienced a sharp growth in July, recording 1%. For the remaining period, the change in the price of copper fluctuated, accounting for approximately 1.5%. For the zinc, it increased slightly until February before it dropped significantly over the next 4-months period. In October, there was a significant growth in the price of zinc, recording the highest change percentage in December with 2%.
Band Score 5The line graph illustrates the average monthly change in the costs of cooper, nickel, and zinc throughout 2014. Overall, nickel witnessed a dramatical drop over the given period, becoming the cheapest in December, while zinc and copper fluctuated over the year, with zinc becoming the most expensive metal in December. Looking at the the price of copper in detail, it declined significantly until June, falling from 6% to -3%. After that, it remained steady for three months after increasing by 2% in July, accounting for 1% in December. Regarding copper, it decreased moderately until June, making up just under 0%. Afterwards, it experienced a sharp growth in July, recording 1%. For the remaining period, the price of copper fluctuated, accounting for approximately 1.5%. For the zinc, it increased slightly until February before it dropped significantly over the next 4-months period. In October, there was a significant growth in the price of zinc, becoming the most precious metal in December with 2%.
Band Score 5.5The graph below shows the average monthly prices of three metals during a single year in 2014. It is easily noticed that all three medals regardless of their starting position of the price, they ended almost with the same price, between 10% and 20%. Nickel was the most expensive metal at the biggening of the year but had a huge decrease in the following months, with the lowest point in June that reached minus 30% of the price. In addition, Copper and Zinc, had the same price as they ended with slightly increase of Zinc and a downgrade of Copper. They both reached minus 0 at the biggening of the summer, Copper reached 10% and stayed there, on the other hand, Zinc stayed below 0 until autumn to end up at 20% in December. To sum up, the biggest percentage of price decrease had to happen to Nickel metal, a huge downfall from 60% to minus 30%. Apart from that, every metal saw a loss of percentage until December which all metals ended at the same price.
Band Score 5.5The line chart illustrates average monthly change in price of three metals -- copper , nickel, and zinc. Overall, Nickle was the metal with the highest initial price , however it is the same metal facing the highest decline in price among three of them. Moreover, least change was recorded in copper's price. Initially, in January 2014, Nickel price was 6 points, which declined to its lowest -3 point in the month of June, in contrast, it got stable to some extent and hit the point 1. Still remaining lower than its starting price. On the other hand, copper started from 2 points, reduced at June around -0.5 points and surged up-to 1.5 points in December. However, the case is quite different for zinc, originally, it had a value of point 1, afterwards it faced some fluctuations, but in the late 2014 it closed at 2 points, highest than both previously mentioned metals. The similarity among all three metals prices is that they all reached its lowest in June.
Band Score 5.5The line graph illustrates the average monthly change in the prices of three metals during 2014. The three metals are Copper, Nickel, and Zinc. The figures are presented in percentage changes in price compared with the previous month. Overall, over the years, at the start of the year, the nickel price is high level. While, at the same time, zinc price level is low. The copper price level is fluctuating this year. Looking at the details, the nickel starting price change percentage is 6, which was the highest among other metals. After six months, the nickel price percentage is a decreasing level. That percentage level is minus 3. After next month, increased in 2 percentage points, and for the following three months, it remained stable. Then, the percentage is increased in plus amount. However, the zinc and copper first month price percentages are 2 and 1. In the end, it shows that end of the year price of the metals are same percentage.
Band Score 4.5copper, nickel and zinc are one of the most important metal used in our daily life. Although they are used in electric wire , moter etc.All of these are metal are knowm for there specific function they perform. As the graph show the price of these metal have fallen or desreased throughly a year. first of all let examine the price of copper it was gereally same all across the year with few increase and decrease in price. Secondly, nickel the price was too much high in tha starting of the year but generally with huge decrease. At the end zinc it price increase desrease as same as copper with little increase and decrease in price. in the end, it shows that at the end of the year price of these metal are same. but eventually at the start nickel price was too much high with respect to cooper and zinc.
Band Score 6The line graph renders an analysis of the changes in cost of copper, nickel and zinc over a one year period , spanning from January to december. Overall, it can be clearly seen that the copper price remains almost the same over the given period, whereas the other two metal experinced fluctued trend. Regarding the specifics, in January, the price of nickel changed by 6%, which was the highest among other metals. Over the month, the price of nickel experienced a downward trend and reached negative 3% in the month of June , and it was the lowest compared to copper and zinc . However , again it was rising and stood at 1% change the price of nickel in the end of year. In January, the copper and zinc price changes were at 2% and 1%. Zinc price were rose in February by 2% and again followed a downward trend till Octobefr and reached by -1 %, whereas the copper remained almost same by 2% over the given period.
Band Score 6The line graph besides illustrates the average monthly changes in the price of copper, nickel and zinc in 2014. Overall, it is clear that the three of them were in a downward trend. The cost of nickel and zinc shared the same trend together, although there was a small different at the beginnings of the period, whereas the copper price held the steadiest proportion. In the first month of 2014, the percentage of nickel price was the largest, with 6 percent change higher than the last month, then hit the lowest point of about 1 percent in May. By contrast, the cost of zinc was the smallest degree, with only 1 percent but went up exponentially to the amount of 6 percent, reaching 6 times of what it was at the beginnings of the period. There was a dramatic decrease which push the amount of zinc to minus 1 percent. However, as it is mentioned before, zinc and nickel shared the similar trend of slight increase until the end of the whole period. Meanwhile, the rate of copper was less fluctuated. It declined slowly to about minus 1 percent in June and then increased to 1 percent in the next month. However, the proportion kept a trend that remained steadily until December.
Band Score 6The line graph illustrates a comparison of the proportion change in prices between three metal categories during twelve months period in 2014. Overall, there was a significant shift in prices of three metals over the period. Nickel experienced the most decline compared to others. Meanwhile, copper remained the most stable. In additon, all three metals ended the year with major fluctuations. In January, Nickle began with the highest increased, showed the significant price with 6%. However, Nickle plunged to 1% in just 3 months later before dropping to -3% in June, which was the most lowest figure had been recorded over the graph. Despite fluctuation, but was not has a significant , until grew enormously to 1% in december. Zinc and copper followed a similar downward during this six months period, with both metals seeing their price growth to approximately -1% and just below 1% by June.In the second half of 2014, the prices of these metals began to recover. Nickel’s price change fluctuated between -1% and -2% from July to November before climbing back to 1% in December.Constantly, zinc experienced a gradual recovery, with its percentage change rising steadily to peak at 2% in the final month. Meanwhile, copper prices remained relatively stable, fluctuating around 1% to 1.5% from July onwards and ending the year with a 1.5% increase in December
Band Score 6The line graph demonstrate the average monthly change in the prices of three metals during 2014. Overall, all three metals experienced a downward trend in their prices changes during the first haft of the year, followed by a slight in second half.Similarly,Nickel showed the most significant fluctuations, while copper maintained the most stable price movement. In January, nickel reach the highest increase in price change at 6%,followed by zinc at 1% and copper at 2%.However, the price growth for nickel fell sharply over the next few months, its lowest point of -3% in June.Zinc and copper followed a similar downward during this six months period, with both metals seeing their price growth to approximately -1% and just below 1% by June.In the second half of 2014, the prices of these metals began to recover. Nickel’s price change fluctuated between -1% and -2% from July to November before climbing back to 1% in December.Constantly, zinc experienced a gradual recovery, with its percentage change rising steadily to peak at 2% in the final month. Meanwhile, copper prices remained relatively stable, fluctuating around 1% to 1.5% from July onwards and ending the year with a 1.5% increase in December
Thanks